Transform Data Into Actionable Insights

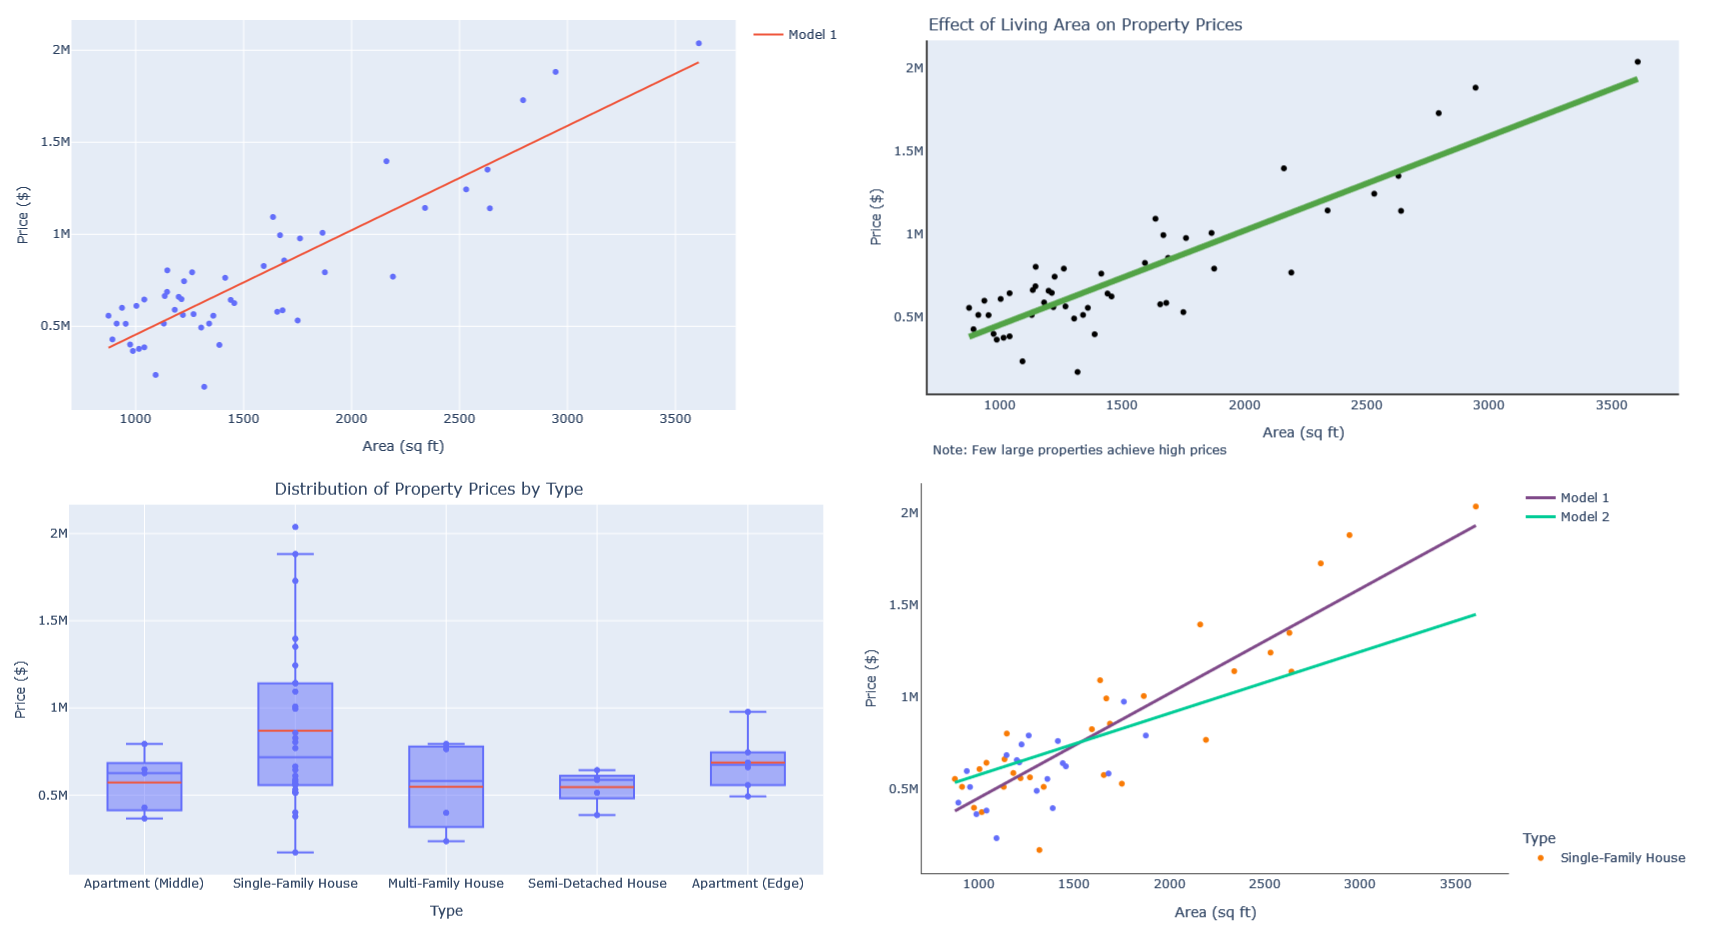
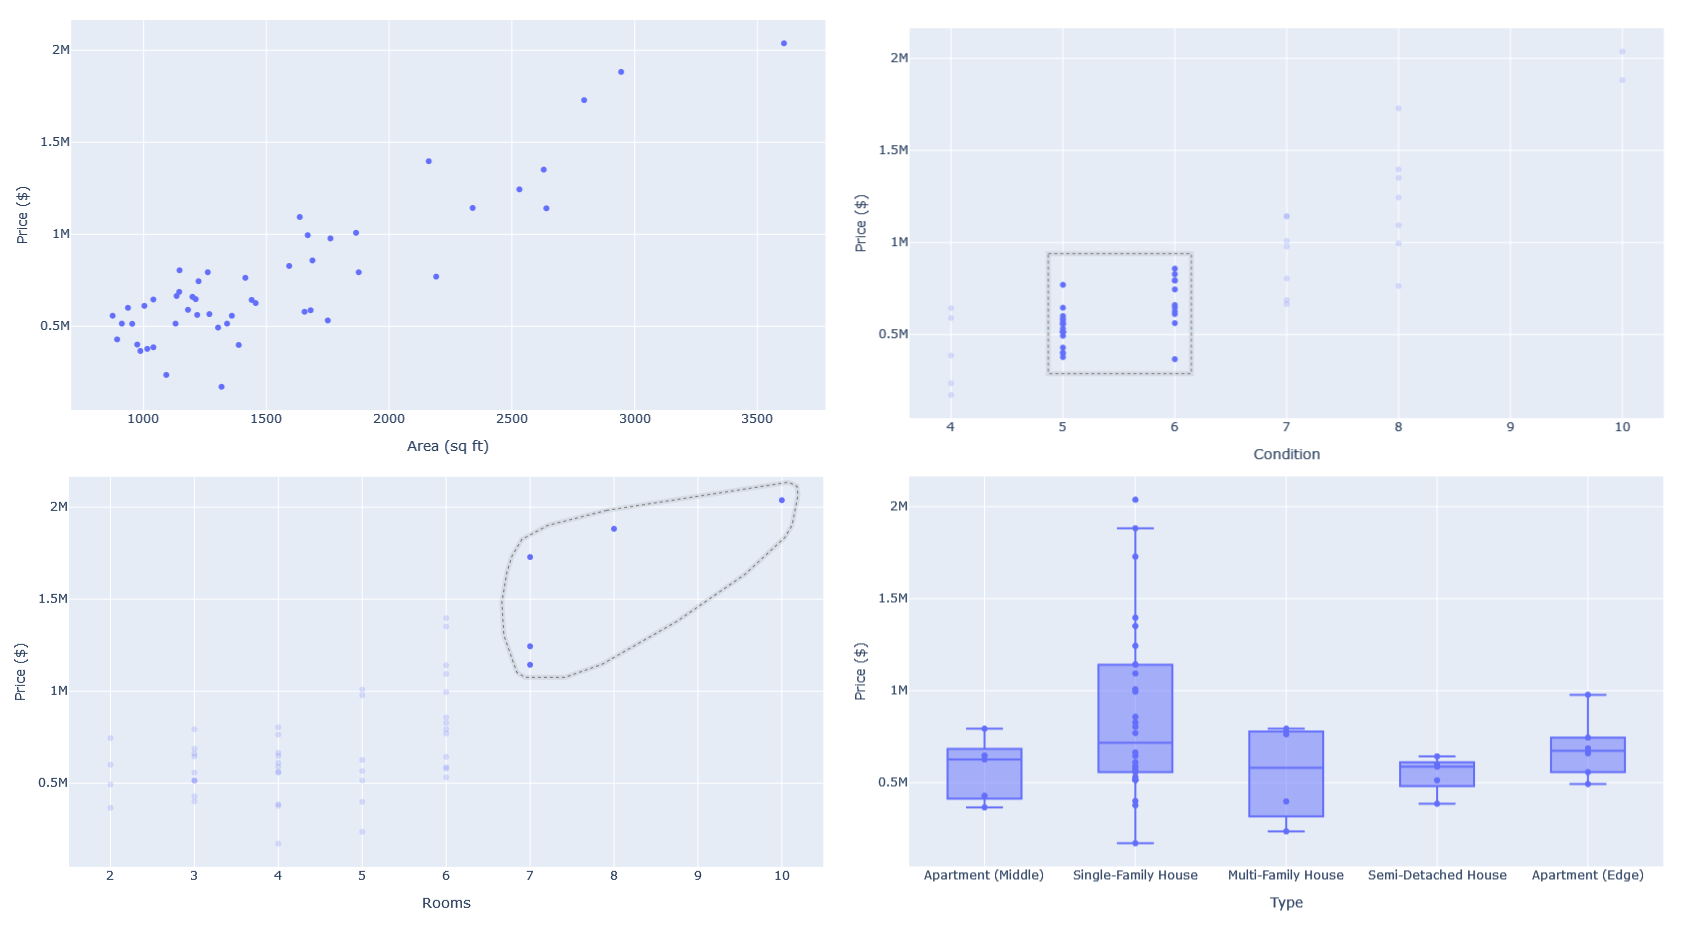
Save time and use our linear regression calculator to gain more insights into your data and make better decisions instead of spending hours programming.

  • Upload your own data from CSV or Excel files
  • Simple variable selection for individual analyses
  • Interactive table editing for custom data
  • Automated plot creation with various styling options
  • Comprehensive analyses and results ready for download
Online calculator for linear regression with example

Regression Analysis: What Regression Online Can Do for You

Online calculator – no headaches with SPSS, STATA, or R

Linear Regression Calculator: Quick and Interactive Pattern Recognition

The linear regression calculator helps you analyze data easily and accurately. The user-friendly data analysis tool, lets you quickly perform linear regressions and visually present the results. Optimize your data analysis and make informed decisions based on clear, meaningful graphs and statistical methods. Try out how online linear regression can help you visualize and analyze your data to gain valuable insights.
  • Define texts
  • Define element sizes
  • Style element colors
  • Set font colors
Regression analysis to determine linear regression line
No black box, but clear and understandable results

Unlock Data Insights for Smarter Decisions with Regression Analysis

Regression Online shows results of multiple models, allowing users to compare and track different data analyses. Results can be downloaded, include interpretations, and provide additional statistics such as the coefficient of determination. The data evaluation enables users to make informed decisions and gain deeper insights into their data. Our user-friendly interface and comprehensive regression analysis make it easy to understand complex statistical relationships and identify the best models for specific needs.
  • Regression table for download
  • Comparable experiments
  • Interpretation
  • Detailed metrics
results of linear regression

Linear Regression Online: Easy, No Coding Required

Individual plots

Pattern Recognition with Exploratory Data Analysis

Discover our tool for exploratory data analysis. Our data visualization tool allows you to select various variables and display automatically generated and customized charts. Optimize your data analysis with intuitive features that provide deep insights into your data and support decision-making processes. Ideal for entrepreneurs, analysts, researchers, and anyone looking to conduct thorough data analyses.
  • Easy variable selection
  • Automatic plots
  • Highlightable areas
  • Instant download
Regression analysis to determine linear regression line
Your own data

Custom Data Analysis

With our data upload tool, you can easily upload and edit your own data tables. The user-friendly interface includes built-in formatting and allows you to adjust your data in real time and receive instant feedback. Your data is only used for the calculation of the analysis and is not stored!
  • Upload your own data
  • Editable data table
  • Built-in formatting
  • International decimal separators
custom data for your linear regression analysis

Generate Data From Your Linear Regression Model

Simulate smart and sample with precision: Generate realistic data points from linear regression models - ideal for testing, training, and prototyping.

Your Fake Datasets

Our sampling tool lets you quickly generate high-quality synthetic datasets based on linear regression parameters. Get the data you need - fast and flexible.
Define Your Model
Specify your own linear regression model to generate exactly the data you need.
Customize Sampling
Full control over simulated data: Fine-tune your data by configuring distributions parameters and noise levels
Plots
Simulated data is seamlessly integrated into linear regression visualizations.
Data
Work with your data samples: Compare them, download them or discard datasets you don't like.

High-Quality Customizable Synthetic Data

Define your own linear regression models and customize the data generation process using flexible distribution parameters. Generate fake data with full control over the model and sampling behavior.
Step 1
Draw
Define your linear model by setting the intercept and coefficients. This model serves as the foundation for generating your synthetic dataset. The simulated data will be tailored to your regression line.
Step 2
Generate
Define distribution parameters used to generate your synthetic data. Customize values such as noise, mean, or variance to control how tightly the data clusters around your regression line.

Work With Your Generated Data

Your data is ready for exploration and comes to life with built-in visualizations. Instantly download your datasets as Excel or CSV. Select and compare plots that show exactly how different synthetic data samples align with your corresponding linear regression model.
  • Inspect and compare generated datasets
  • Download data samples as Excel or CSV
  • Discard samples not needed

Ready to use the linear regression calculator?

Use Regression Online and focus on what really matters: your area of expertise
Interactive
Results immediately
Plot included
Established tool